
WARNING: technical content ahead! There’s also a tonne of config files, which make this page look longer than it really is, but hopefully they’ll help other people who want to do similar work.
A few months back I replaced my OpenWRT router with a CentOS 7 based one. This machine has been working very well, and handles my Gigabit FIOS traffic without any issues.
I came across a post from Jim Perrin around using tools to collect data and draw graphs on it.
Now I’d started to play with collectd a few years ago, but never went anywhere with it (I still had the source tree from where I compiled it!). Jim’s solution looked simple enough…
He had everything running on the router, but I wanted to keep as much load off the router as possible; let it handle the job of routing packets; databases and graphing can be done elsewhere :-) So I built a small VM (512Mb RAM, 15Gb disk) and called it “monitor”. This also allows me to collect data from other machines and consolidate to one point.
Starting with influxDB
I did things in a slightly different order; I started with the database. That way I could check that collectd was sending data correctly.
So, following Jim’s instructions, I added the repo and installed the software.
% cat /etc/yum.repos.d/influxdb.repo
[influxdb]
name = InfluxDB Repository - RHEL $releasever
baseurl = https://repos.influxdata.com/centos/$releasever/$basearch/stable
enabled = 1
gpgcheck = 1
gpgkey = https://repos.influxdata.com/influxdb.key

% sudo yum install influxdb
[...]
We now need to configure it. I noticed that the defaults log a lot of
information; so this configuration turns off all that. You might want
to leave it on while building, but beware that your /var/log/messages
file will grow large!
The effective configuration is:
reporting-disabled = true
[meta]
  dir = "/var/lib/influxdb/meta"
  logging-enabled=false

[data]
  dir = "/var/lib/influxdb/data"
  wal-dir = "/var/lib/influxdb/wal"
  query-log-enabled=false

[http]
  enabled = true
  bind-address = ":8086"
  log-enabled=false

[[collectd]]
  enabled = true
  bind-address = ":8096"
  database = "collectd"
  typesdb = "/usr/share/collectd"
There are more sections in the file which probably need to be kept there, but everything inside those sections are commented out; they’re the defaults.
Now the collectd section needs to see types.db file from collectd.
If you have the collectd RPM installed then this lives in /usr/share/collectd/types.db, otherwise you’ll need to copy the file over. The config file
points to the directory the file lives in.
Startup and run the server:
% sudo systemctl enable --now influxdb

% ps -ef | grep influx
influxdb  2597     1  0 Aug31 ?        00:25:34 /usr/bin/influxd -config /etc/influxdb/influxdb.conf
collectd
Now we can configure collectd on the router. Since this is in EPEL,
make sure you have the repo enabled and then it’s simple to install:
% sudo yum install collectd
The configuration file is pretty simple:
Hostname    "router"
FQDNLookup   true

BaseDir     "/var/lib/collectd"
PIDFile     "/var/run/collectd.pid"
PluginDir   "/usr/lib64/collectd"
TypesDB     "/usr/share/collectd/types.db"

LoadPlugin syslog
<Plugin syslog>
        LogLevel info
</Plugin>

LoadPlugin cpu
LoadPlugin df
LoadPlugin disk
LoadPlugin interface
LoadPlugin load
LoadPlugin memory
LoadPlugin network

<Plugin df>
        ReportInodes true
</Plugin>

<Plugin disk>
        Disk "/^([hsv]|xv)d[a-z][0-9]?$/"
</Plugin>

<Plugin network>
        Server "10.0.0.150" "8096"
</Plugin>
(I’ll come to the “Disk” line a little later).
Let’s start it up!
systemctl enable --now collectd
Verifying it works
At this point collectd should be sending data into InfluxDB. We
can check this:
% influx
Connected to http://localhost:8086 version 1.3.5
InfluxDB shell version: 1.3.5
> use collectd;
Using database collectd
> show measurements;
name: measurements
name
----
cpu_value
df_value
disk_io_time
disk_read
disk_value
disk_weighted_io_time
disk_write
interface_rx
interface_tx
load_longterm
load_midterm
load_shortterm
memory_value
Excellent! InfluxDB has a simple SELECT syntax so you can look
inside each of the measurements for the raw data.
The default settings for influxDB allows it to retain data for 7
days. If you want to keep data for longer then you’ll need to create
a new retention schedule. In my case I wanted 2 months:
> create retention policy two_month on collectd duration 62d replication 1 default;
> drop retention policy autogen on collectd;
> show retention policies;
name      duration  shardGroupDuration replicaN default
----      --------  ------------------ -------- -------
two_month 1488h0m0s 24h0m0s            1        true
Grafana
Let’s head back to Jim’s tutorial… we can now install Grafana on
the monitor machine.
% cat /etc/yum.repos.d/grafana.repo
[grafana]
name=grafana
baseurl=https://packagecloud.io/grafana/stable/el/6/$basearch
repo_gpgcheck=1
enabled=1
gpgcheck=1
gpgkey=https://packagecloud.io/gpg.key https://grafanarel.s3.amazonaws.com/RPM-GPG-KEY-grafana
sslverify=1
sslcacert=/etc/pki/tls/certs/ca-bundle.crt

% sudo yum install grafana
Configuration is pretty simple; just set the admin user/password in
the [security] section. (We’ll take a look at security in a little
bit).
% sudo systemctl enable --now grafana
At this point I was able to go to http://monitor:3000/ and
login as the admin user.
We’ll be required to set up a datasource. Because influxDB is on the same machine, we can simply use these settings:
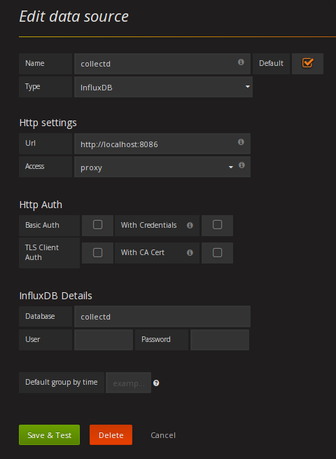
localhost URL is highlighted and not
dim.
Creating a dashboard
We’re now ready to create a dashboard to look at all this data. Jim recommended the Host overview dashboard, so that’s where I started.
I realised that some of these graphs were not suitable for a router; for example the networking graphs take the total over all interfaces, which means that “received” and “sent” values are almost identical. After all a router receives data on one interface and sends it back out again on another :-)
The GUI makes it pretty easy to edit panels, move them around, add/remove
entries. I wanted the network panels to only refer to br-wan (the
interface I use for connecting to the internet). I also didn’t care too
much about disk space on this dashboard.
The resulting JSON file is here, if it helps. I can now quickly see my internet usage and CPU load on the server.
Multiple hosts
At this point it becomes very easy to deploy this to other servers.
Since my internet hosts are connected via a VPN I can use the same
file everywhere. A simple ansible script let me deploy to all
the hosts I wanted:
---
- name: Set up collected
  hosts: collectd
  become: False

  tasks:
    - yum: name=collectd state=present

    - service: name=collectd enabled=yes state=started

    - name: collectd.conf
      template: src=Files/collectd/collectd.conf.j2 dest=/etc/collectd.conf owner=root group=root mode=644
      notify:
      - reconfig

  handlers:
    - name: reconfig
      service: name=collectd state=restarted
The “conf” file is identical to the one previously shown, except for the one line:
Hostname "{{ ansible_hostname }}"
I also added a line for my VM server to collect virt stats:
{% if ansible_hostname == "penfold" %}
LoadPlugin virt
{% endif %}
A quick ansible-playbook command and a few minutes and now I have 7
machines all sending data to influxDB and they now all magically show
in the ‘Host Overview” dashboard.
This also explains the odd “Disk” line in the config. The various machines may show hd* or sd* or vd* or even xvd* (Xen client). I also wanted to not collect data for metadisks (md0, md6, etc).
Security
Now this configuration has a lot of things that I’d scream about at
work. We’re exposing services to the network without proper access
control (primarily influxDB). This means that anyone on my network
could send funky data and pollute my database or even read data. There’s
no sensitive data stored here, but it’s not a good configuration and would
never be acceptable in an enterprise environment.
The tools do allow for authentication and TLS; InfluxDB documentation
goes into quite some detail on how to configure this, and both collectd
and Grafana can be configured to authenticate to talk to it.
However, I’m not an enterprise; guests are on the guestnet and can’t see this server; I’m not exposing it to the internet…
No doubt this will come back to haunt me at some point :-)
Conclusion
I’m actually not a fan of GUIs for management. This form of “eyes on glass” monitoring means that issues may be lost. However they do have benefits; oddities may stand out.
Indeed, one oddity showed up almost immediately:
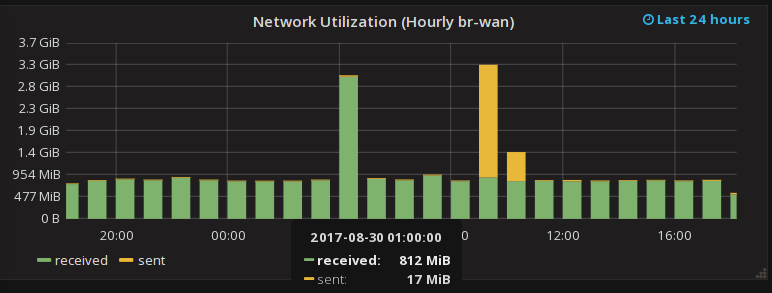
Why is my network baseline downloaded 800Mbytes/hour? That seems high!
I was about to hunt down what server was doing a constant 200Kbyte/sec when it struck me… my speed check tester downloads 200Mbytes every 15 minutes; 4 times an hour. That’s 800Mbytes, right there :-)
This graph also clearly shows when I downloaded backups from my internet hosted servers, and when I uploaded my backups to Amazon cloud :-)